Water for Coffee - Reasons
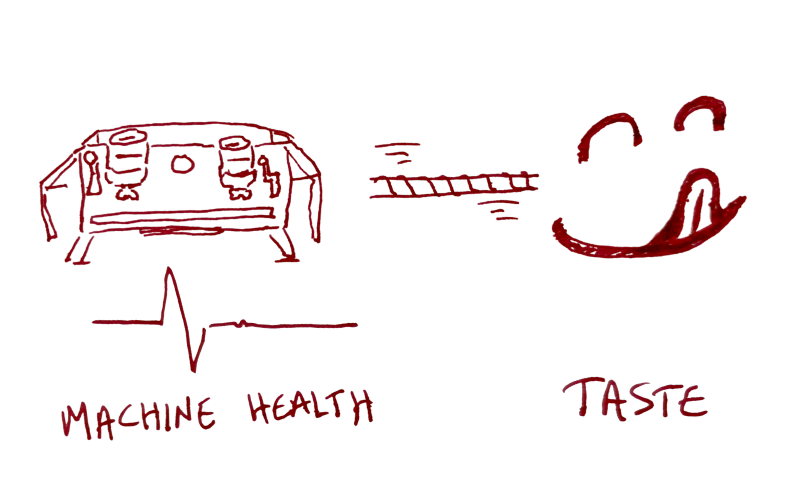
The water you use for coffee in a cafe has competing goals.
First, it should make your coffee taste great.
Second, it shouldn’t damage your machine, either by covering the insides with scale or by corroding out the guts.
It's kind of a tug of war between those two things, and you want, as Wally Schirra famously said, to maintain an even strain.
Home baristas don't have this problem at this scale; they're pulling 5, maybe 10 shots a day if they're some nerd-engineer couple. You're pulling 100+. You are running a LOT of water through your machine.
You should know the basics of water (NO chemistry class, I promise). Let's start with the great triangle of water for coffee in cafes:
Corrosion - scaling - taste
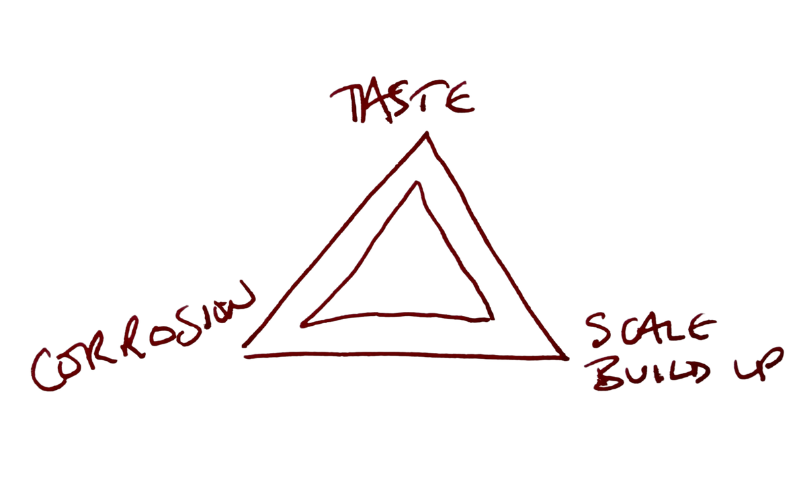
The simple version is: The tastier your water, the more likely you are to build up scale inside your machine.
That's not technically accurate for the nit-pickers, but for those of us in the real world, well, that's just how it works out by and large.
Too hard
Water that is harder, (higher calcium hardness and alkalinity) generally scales more.. There’s a bunch of complex chemistry reasons behind this, but that ground truth holds.
Too clean
Water with too little in it (low alkalinity, low mineral content) becomes “hungry”, and attacks the metals inside of your stainless steel boiler. This is much less common, but it's a caution against the "just remove everything" idea that everyone new to water for coffee has when they realize the problems with "too much".
Too chlorinated
Yep, there's chlorine in your water, and it can gut your machine. It's an easy fix with either RO or carbon block, but make no mistake; chlorine in your beautiful machine will open up pits 'n zits in your boiler that you don't want there. If you want to get nerdy you can Google crevice geometry and alloy reactivity. Or you can keep the chlorine out.
For quick reference (and thanks to Caffeine Service for this fact), in-the-field measurements of RO water as low as 20 ppm have been fine for espresso machines over the course of years, and can help with scale and lime in a small way (although RO water should not be thought of as a primary corrective against scale build up.)
So, not too much, not too little.
You want balanced water; not just for taste, but for machine longevity. This isn't unachievable by the way, but you DO have to know where you are and where you want to go.
On The Map
In order to serve excellent coffee that doesn’t ruin your machine, you need to know what kind of water you have.
Think of this as locating yourself on the map. Here in San Diego, we have very hard (216 ppm) and high alkalinity (116 ppm) measured at the tap.
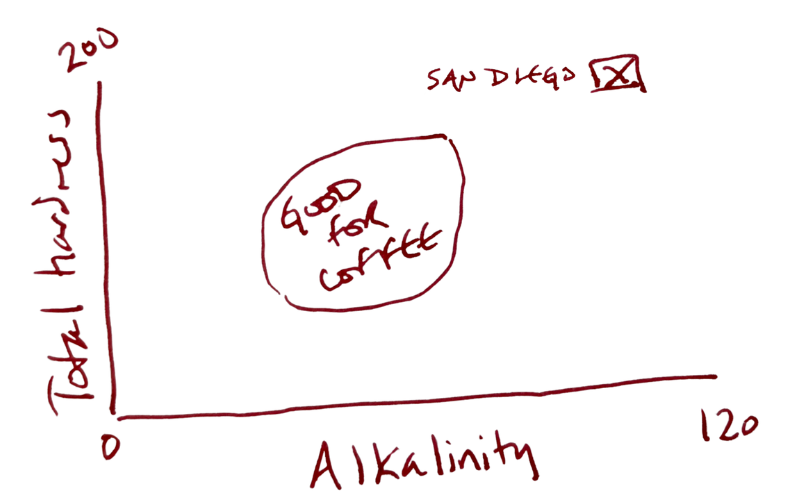
We've got to strip out and buffer up to get the kind of water we want to make really delicious coffee with.
Know Your Water
You can get this information about your local water for (usually) free by finding your municipal water report, you can test yourself for under $100, or you can hire companies to test it for you.
If you run a cafe in San Diego and want to know whether your water is helping or hurting your coffee and equipment, I offer testing and consultation services.
Already have GH/KH/TDS numbers? Paste them into the free Café water diagnose tool (no login, runs in-browser). It folds your readings through the causal map distilled from Maxwell Dashwood and Christopher Hendon’s Water for Coffee chapters 4–10, then guesses what flavour and hardware pressure you probably feel.
You want to test 3 water sources:
- feed water (the water coming into your shop)
- treated water (the water going into your machine after you've treated it)
- heated water (the water coming out of your group head, NOT hot water dispenser)
This helps you know what you need to treat, how well your treatment is working, and whether or not your machine needs maintenance.
You can download the same cafe water audit worksheet I use and fill in the blanks below (PDF).
Once you get basic measurements on the water going into your machine, you’ll have a custom map for your situation.
You may need to do nothing.
You might need to add (or change) your filters.
You might need to add minerals.
Most of that is neither complicated nor particularly expensive, especially compared to the cost of replacing a coffee machine or losing a customer.
If you don't have a treatment system or you want to upgrade to a more solid setup, figure on ~ $1,500, though you can spend more or less depending on what you need.
Why Test? The Expensive Lesson
The average espresso machine in a cafe costs about $5k. Sure, sure, yours was more (or you got a deal for less), but if you had to replace your machine tomorrow because it died, on average you’d spend about $5k.
The average per-visit spend in specialty coffee is somewhere between $7 and $16 (see source table below).
Whether you want to calculate your loss if your machine is down for a few days and you don't sell your 100 cups a day, or you want to calculate using a rough average customer annual spend value of $800 and assume you lose more than 1 customer per year just because you have weak, sour, or sharp coffee because you overstripped your water, the takeaway is:
Treating Water Saves You Money
It's not a guess, it's just math. Customers don't regularly spend $6 for a cup of coffee that would be worse than what they'd make at home, and if you provide them bad coffee (or even worse if you shut down for a few days while you repair/replace a machine, no coffee), they'll find someone else locally to go to.
Sources & Calculations For The Econ Nerds
In order to not clutter up the stats quoted above and to make sure we're all singing off the same sheet of music, I put all the sources and stats below along with tables for you to see for yourself.
Perhaps your espresso machine was cheaper. Maybe your customers spend more (or less), or they stick around for longer or shorter. Whatever it is, here's how I got the numbers.
TL;DR (Yeah, yeah, a TL;DR before the Long Version, I know)
Per-visit: The range is $7–$16, with most transactions clustered in the $8–$13 zone. No single US POS provider publishes an "average café ticket" figure for public consumption, so the range is built up from three independent data sources that converge on the same answer.
Customer Lifetime Value: A weekly regular is worth ~$2,200 over 4 years. A few-times-weekly regular is worth ~$6,300. A daily regular is worth ~$12,600. I used the lowest version for my "annual value" number.
A specialty-cafe regular is worth roughly $5,600–$7,200 over their lifecycle.
Per-Visit Spend
Caveat: No US POS provider publishes an "average café ticket" figure for public reporting. Square's quarterly US reports cover tipping percentages, wage growth, and same-store transaction trends, but not absolute ticket size at coffee shops.
Toast's 2026 Restaurant Trends Report, drawn from ~164,000 US restaurants on its platform and analyzing same-store sales from January 2024 through December 2025, publishes drink-level medians from actual transaction data.
In February 2026 a regular drip coffee was $3.65, cold brew was $5.58, and a latte ran about $5.50. Specialty drinks are growing (lattes +4.0%, espresso shots +3.3%, Americanos +1.4% in 2025) while traditional formats decline (drip -3.3%, cold brew -2.2%, black tea -3.4%, green tea -4.9%). Toast's read: Americans are visiting cafes less but treating themselves more when they do. That unit pricing means a single-drink visit sits near $6, a drink-plus-pastry visit is ~$8–$10, and multi-item or multi-person tickets push toward $14–$16.
Three independent cross-checks land on the same range. Square's Canadian café data showed an average café transaction of $13.04 in April 2025 (down from $14.31 the prior year) — Canadian dollars, landing in the middle of the US-derived range.
Drive Research's 2024 US consumer survey (n=1,325 US adults) found 54% spend ≤$20/month at coffee shops while 51% visit at least weekly, working backward to roughly $5/visit on the low end of the spending distribution. The largest US restaurant POS dataset, Square's Canadian café data, and a primary US consumer survey all converge on $7–$16 per visit, with most transactions clustered in the $8–$13 zone.
Customer Lifetime Value (CLV)
The math here combines Toast per-visit data with Drive Research's frequency tiers and an assumed customer lifespan of 4 years (the soft input — see caveats below).
What's a coffee shop customer actually worth?
The inputs we have hard data for: Per-visit spend: $8–$13 zone, from Toast's 2026 Restaurant Trends Report covering ~164,000 US restaurants.
Visit frequency distribution from Drive Research's 2024 US consumer survey (n=1,325 US adults): 8% buy from a coffee shop daily, 27% a few times a week, 16% weekly, 17% every few weeks, 8% monthly, 17% less often than monthly, 7% never.
Now, we don't know actual customer lifespan at a cafe — how long a "regular" stays a regular before moving, changing jobs, or losing the habit.
There's no clean public dataset I could find for this. Industry rules of thumb: 3–5 years for a neighborhood specialty shop with a stable customer base, 1–2 years for transit-oriented kiosks, 7+ years for destination shops. We're using 4 years as the midpoint.
The Math
Using $10.50 per visit and 4-year lifespan:
| Archetype | Visits/yr | Annual spend | 4-yr CLV |
|---|---|---|---|
| Daily regular | ~300 | $3,150 | ~$12,600 |
| Few-times-weekly | ~150 | $1,575 | ~$6,300 |
| Weekly visitor | 52 | $546 | ~$2,200 |
| Every few weeks | ~18 | $189 | ~$760 |
| Monthly | 12 | $126 | ~$500 |
| Occasional (less than monthly) | ~6 | $63 | ~$250 |
The Regular
The blended average regular — weighted by Drive Research's frequency distribution among customers who visit at least weekly (the addressable "regulars" segment, which is 51% of US adults) — works out to ~$5,600–$7,200 CLV.
More Caveats
(sheesh, you'd think this was a hardcore PhD thesis defense session based on the emails I've gotten on this!)
- Lifespan is the soft input. Assume 3 years instead of 5 and a daily regular's CLV drops from $15,750 to $9,450. Most small businesses don't last 2 years, but I'm rootin' for ya to crush with your coffee shop!
- Per-visit is national, not specialty-adjusted. Toast's median pulls from all restaurants serving coffee, including QSRs and full-service. A pure specialty cafe's per-visit median is likely $10–$14, which nudges all CLVs ~20% higher.
- CLV is revenue, not profit. Duh. Coffee shop gross margin on a $10 ticket is typically $6–$7 (COGS ~30–40%). Net margin after labor, rent, and everything else is closer to $0.50–$1.50 per ticket. The $12,600 daily-regular CLV translates to roughly $1,200–$1,900 in actual profit over four years. Still, who wants to lose a thousand bucks because they don't change a $20 filter?
CLV — The receipts
| Customer type | Annual spend | 4-yr CLV | Source for the math |
|---|---|---|---|
| Daily regular | $3,150 | $12,600 | $10.50 × 300 visits/yr × 4 yrs |
| Few-times-weekly | $1,575 | $6,300 | $10.50 × 150 visits/yr × 4 yrs |
| Weekly | $546 | $2,200 | $10.50 × 52 visits/yr × 4 yrs |
| Every few weeks | $189 | $760 | $10.50 × 18 visits/yr × 4 yrs |
| Monthly | $126 | $500 | $10.50 × 12 visits/yr × 4 yrs |
| Less than monthly | $63 | $250 | $10.50 × 6 visits/yr × 4 yrs |
| Blended regular (weekly-and-up, 51% of adults) | $1,400–$1,800 | $5,600–$7,200 | Weighted by Drive Research frequency tiers |
Source Table
| Source | What they publish | Why it's credible |
|---|---|---|
| Toast — Feb 2026 coffee prices | Median drip $3.65, cold brew $5.58, +4.3% and +4.1% YoY respectively | POS provider for tens of thousands of US restaurants; transaction-level data, not survey |
| Toast — Q1 2024 coffee/tea trends | Drip $3.08, cold brew $5.14, latte $5.46, tea $3.74 (state-by-state breakdowns) | Same Toast platform; published as a Restaurant Trends Report |
| Toast — 2026 Restaurant Trends Report | Lattes +4.0%, espresso +3.3%, Americano +1.4% in 2025; drip -3.3%, cold brew -2.2%, black tea -3.4%, green tea -4.9%; energy drinks +8.7%, diet sodas +7.4% | Methodology: same-store sales Jan 2024 – Dec 2025 across Toast's ~164,000 US restaurant platform. The credibility hammer — biggest US restaurant POS dataset there is. |
| Square Canada — Spring 2025 Restaurant Report | Average café transaction $13.04 (April 2025), down from $14.31 in 2024 | Real POS data — but Canadian, not US (always flag this) |
| Square US — Summer 2025 Restaurant Report | Café tip 14.57% Q2 2025; oat milk upcharge ~65¢ | Confirms café category as a real segment in their data; no US ticket size published |
| Square US — Fall 2024 Restaurant Report | Same-store transactions at specialty coffee shops +6% YoY Q3 2024 | Demand-side confirmation; no ticket size |
| Drive Research 2024 Coffee Survey | 54% of US adults spend ≤$20/month at coffee shops; 51% visit ≥weekly; 14% spend $40+/month | Primary consumer survey, n=1,325, US adults, Jan 2024 |
Per-visit build-up math
Starting from Toast's Feb 2026 unit prices:
- Drip only: $3.65 → with tip + tax: ~$5
- Specialty drink only (latte / cold brew / cappuccino): $5.50–$5.60 → with tip + tax: ~$7
- Drink + pastry: $5.50 + $4 = $9.50 → with tip + tax: ~$11
- Two specialty drinks (typical pair): $11 → with tip + tax: ~$13
- Two drinks + food: $17 → with tip + tax: ~$20
That spread is what produces the $7–$16 range, and explains why Square's Canadian average sits at $13.04. The typical café customer is somewhere between "one drink + pastry" and "two specialty drinks."
CLV build-up math
Inputs:
- Per-visit: $10.50 (midpoint of Toast 2026 $8–$13 range)
- Visit frequency tiers: Drive Research 2024 US consumer survey (n=1,325)
- Customer lifespan: 4 years (industry midpoint for neighborhood specialty cafe; varies 1–7+ yrs by location type)
How the daily-regular CLV moves with the lifespan assumption:
| Assumed lifespan | Daily regular CLV |
|---|---|
| 2 years | $6,300 |
| 3 years | $9,450 |
| 4 years (used) | $12,600 |
| 5 years | $15,750 |
| 7 years | $22,050 |
Yes, the lifespan input is doing a lot of the work.
Weighted blended-regular calculation:
Among customers who visit ≥ weekly (51% of US adults per Drive Research):
  Daily (8% of adults / 51% of regulars = 15.7% of segment):    0.157 × $12,600 = $1,978
  Few/week (27% / 51% = 52.9%):                                  0.529 × $6,300  = $3,333
  Weekly (16% / 51% = 31.4%):                                    0.314 × $2,200  = $691

  Sum = $6,002 CLV per blended regular customer

Range $5,600–$7,200 reflects ±10% sensitivity to per-visit assumption
($9.50 to $11.50 midpoints).
Sources
Primary:
- Toast — 2026 Restaurant Trends: Why Coffee Prices Are Rising & Sales Are Shifting ← the anchor source
- Toast — February 2026 Median Hot Coffee Prices Rise to $3.65
- Toast — Coffee and Tea Trends in all 50 States (Q1 2024)
- Square Canada — Spring Restaurant Report 2025 (Canadian; directional only)
- Square US — Summer Restaurant Report 2025
- Square US — Fall Quarterly Restaurant Report 2024
- Drive Research 2024 Coffee Survey
Independent industry coverage of the Toast 2026 report (handy for "this isn't just Toast's marketing" if a Redditor pushes back):
- Daily Coffee News — Toast Report Shows Lattes Rising as Drip Coffee and Cold Brew Slip (Mar 2026)
- Sprudge — The Most Popular Consumer Drink Trends Are Changing Fast
- Restaurant Dive — Coffee, cold brew sales slip as lattes, energy drinks surge
- Restaurant Dive — Tips drop as consumer spending stalls (Aug 2025)
Questions about testing your cafe water? Contact me here.